Scatter charts
Last updated: tbd
Scatter charts display your data as a collection of points, which can either be evenly or unevenly distributed. Each point is plotted based on its own axes values. This helps you determine if there is a relationship between your searched columns.
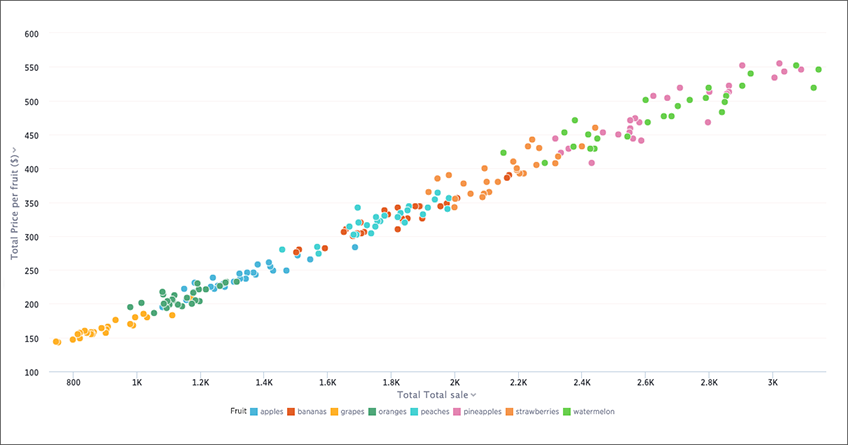
Your search needs at least one attribute and one measure, or at least two attributes, to be represented as a scatter chart.