New bar charts
Last updated: Jan 30, 2026
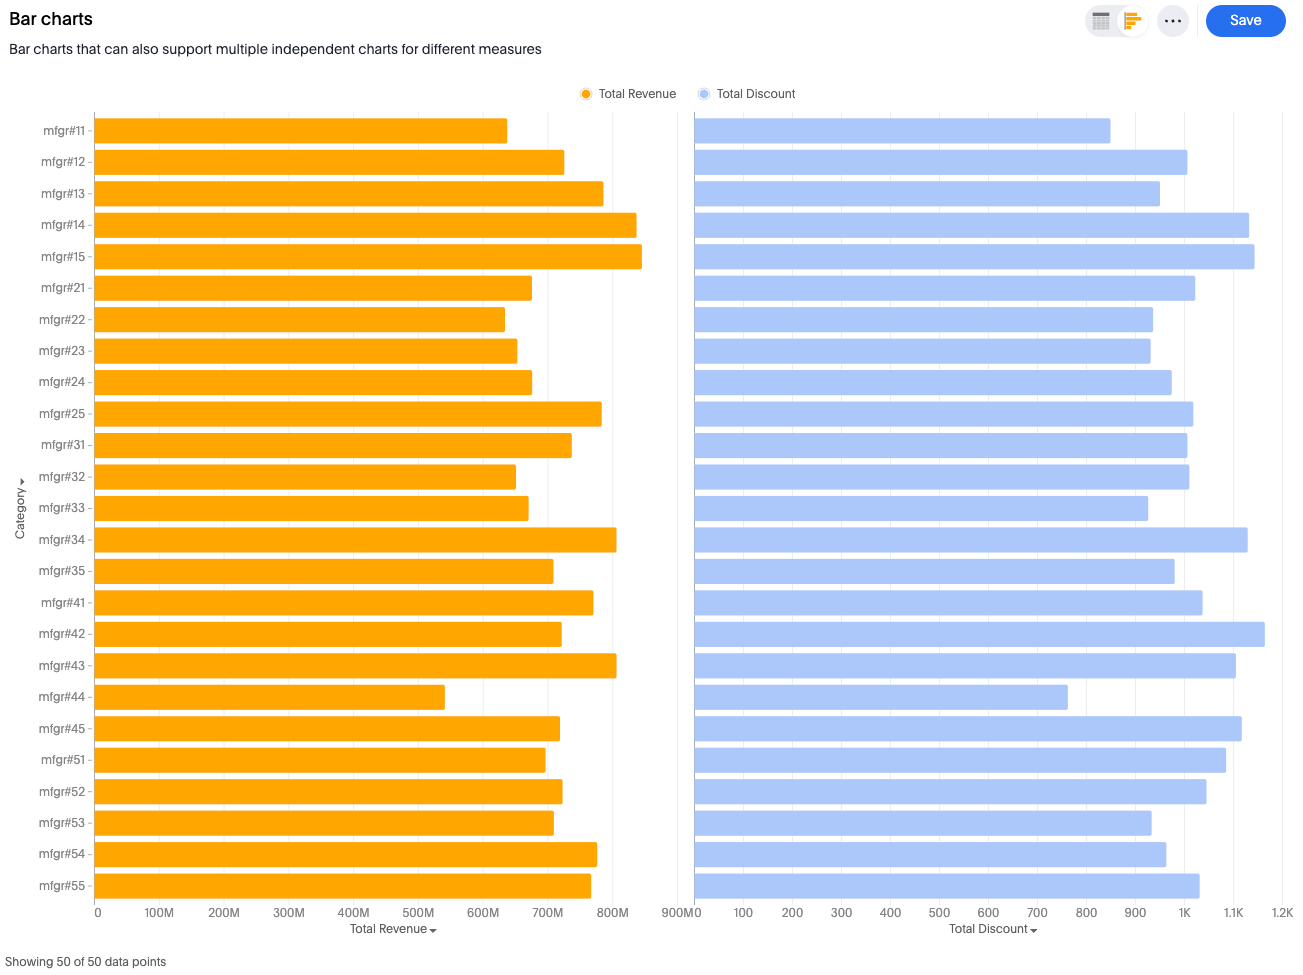
The new bar chart is very similar to the new column chart. The only difference is that it is oriented horizontally, instead of vertically.
Bar charts display your data using horizontal rectangular bars. The length of the bar is proportional to the data value. Your search needs at least one attribute and one measure to be represented as a bar chart.
Limitation
When color slicing is applied to multiple measures, the system automatically converts the visualization into a multivariate chart.
Was this page helpful?Give us feedback!


