New line stacked column charts
Last updated: Jan 30, 2026
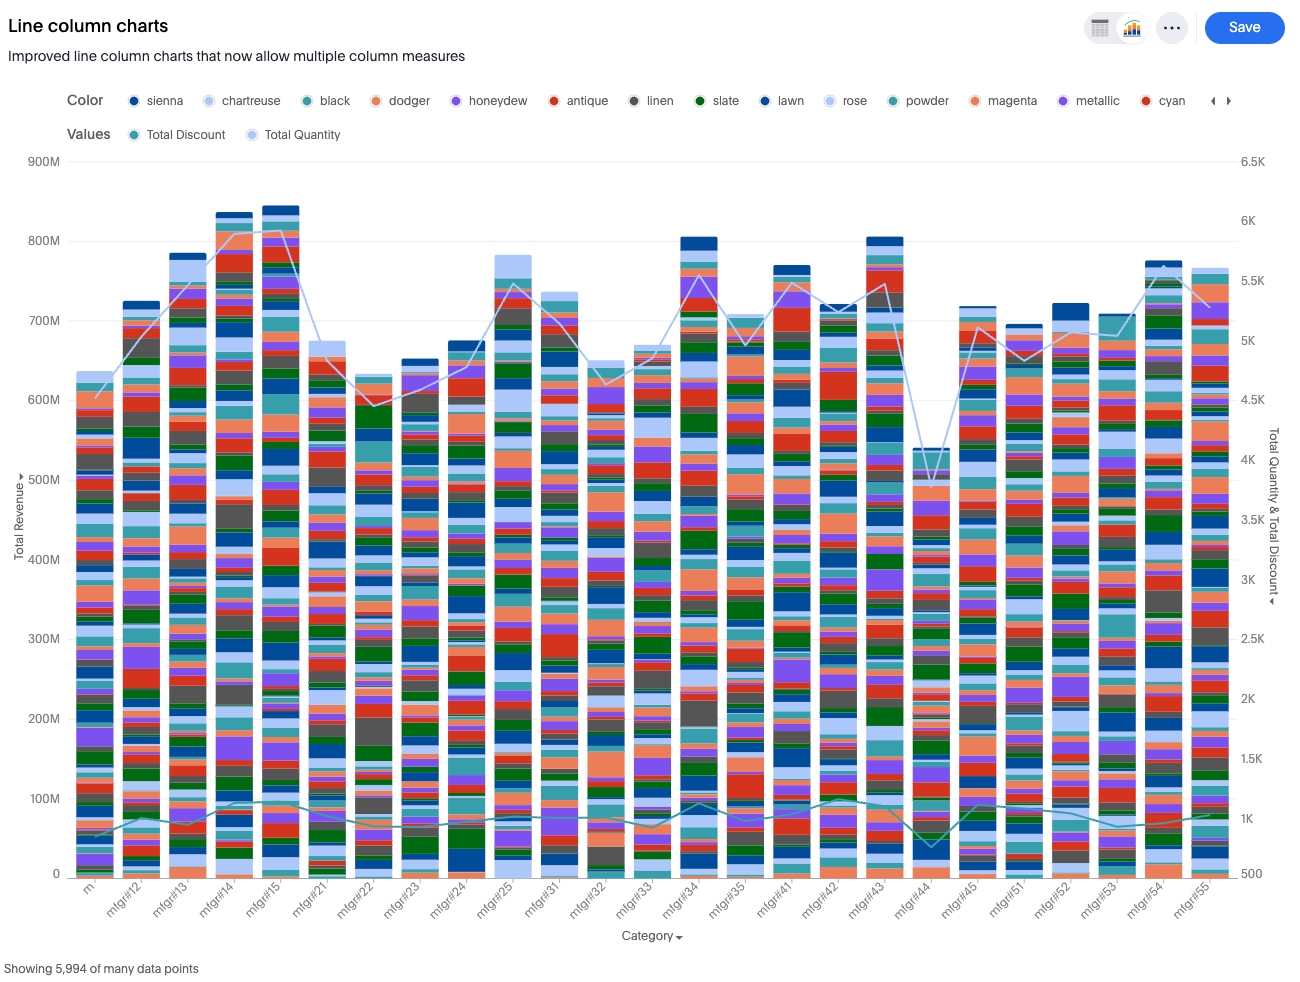
The new line stacked column chart is similar to the line column chart, it divides its columns with an attribute in the legend. The line stacked column chart combines new stacked column and new line charts. There are two y-axes, one for each measure.
Limitations
-
Dual-axis or multivariate axis transitions are not allowed
-
At most one measure can be visualized as a bar.
-
No more than one measure can be added to the column axis.
-
A third axis entity is not allowed.
-
Neither axis entities can be removed nor emptied.
-
Internal dual-axis configuration is not supported for the line axis.
Was this page helpful?Give us feedback!


