Advanced analysis capabilities
Spotter can now read the contents of your data sources and not just the metadata, and can re-run queries when it finds an error. As a data-aware analyst, Spotter can verify its own analysis, access context from coaching and from the data model, and perform advanced data processing to deliver you the most accurate analysis.
We also now support new analysis options. Spotter 3 supports forecasting, correlation, and query-on-query analysis, and can perform complex research using Research Mode.
Analysis and validation
Spotter 3 is the most accurate and consistent version supported in ThoughtSpot. It verifies the analysis it provides and can self-correct its own answers.
- Self-correcting intelligence
-
Spotter 3 automatically detects incomplete answers and digs deeper until the correct solution is found.
- Validates every answer
-
Spotter 3 reviews results to ensure they truly answer your question, iterating as needed for accuracy.
- More context at planning stage
-
Spotter 3 uses coaching, data model instructions, and the information from the complete data model to understand your question better.
- Handles complex questions
-
Spotter 3 breaks down multi-part questions into smaller sub-questions for thorough, complete answers.
- Advanced data processing
-
Spotter 3 supports code execution, research mode, AI summaries, and "why" questions, among other capabilities, for comprehensive insights.
- Refined, actionable answers
-
Spotter 3 post-processes raw data to deliver polished insights you can act on immediately.
Forecasting
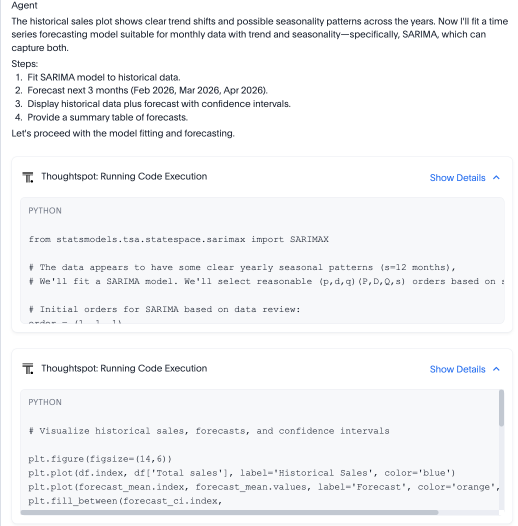
You can now run forecast analysis on your data. For example, you can prompt Spotter to "forecast sales for the next three months."
Spotter first interprets your query, then checks your data for the necessary context.
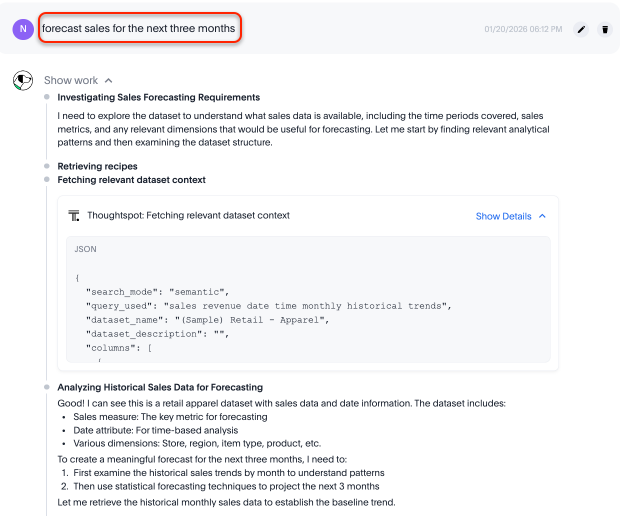
It gathers historical data, such as sales, and generates an answer to refer to.
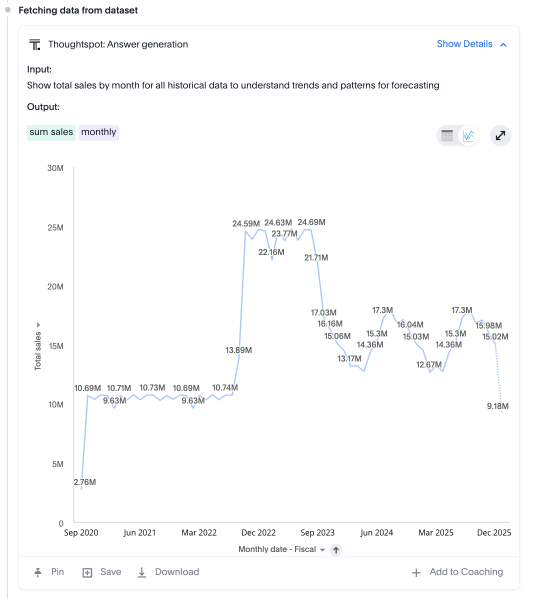
Then it uses Python to examine the underlying data and prepare it for forecasting. It cleans and processes the data, sorting it logically.
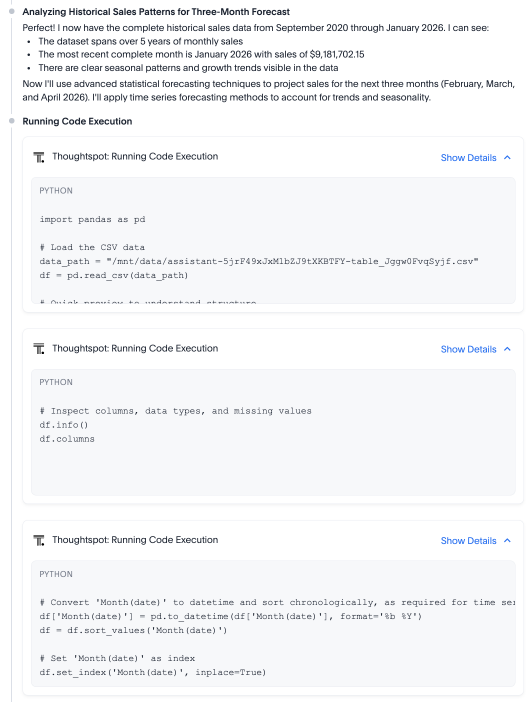
Finally, it chooses a forecasting model, such as Seasonal ARIMA or Holt-Winters Exponential Smoothing, and delivers the answer.
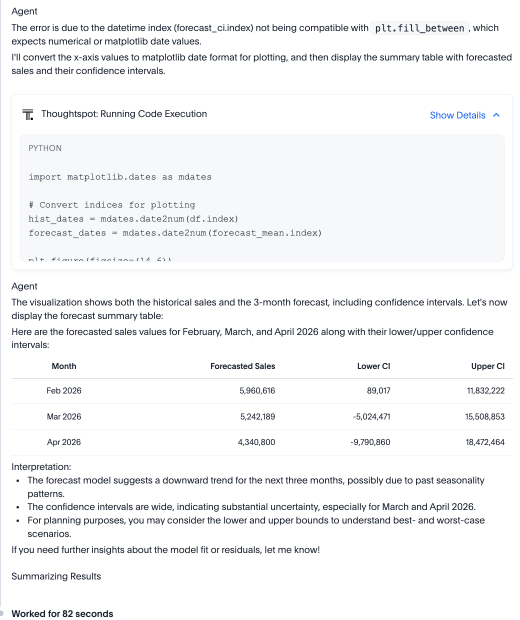
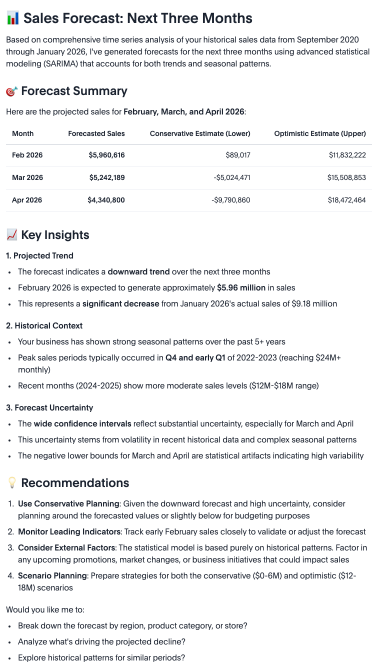
Spotter evaluates whether the forecast is useful, depending on metrics like confidence intervals. It may decide to run another analysis with a different model in hopes of getting more significant results. Finally, it creates a visualization of its answer and adds a list of key insights and business recommendations.
Correlation
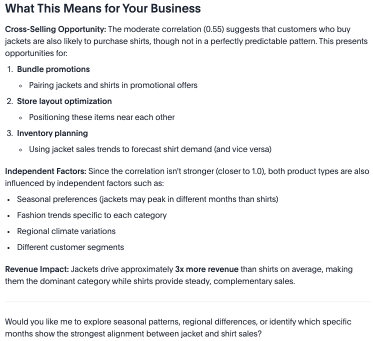
You can now ask Spotter to find correlations between separate variables in your data, like asking if there’s a relationship between cleaning supplies and food item sales in your sales data.
In this example, we asked, "Is there a relationship between jacket sales and shirt sales?" Spotter first fetches data from the relevant data set, creating an answer it can refer back to while it analyzes.
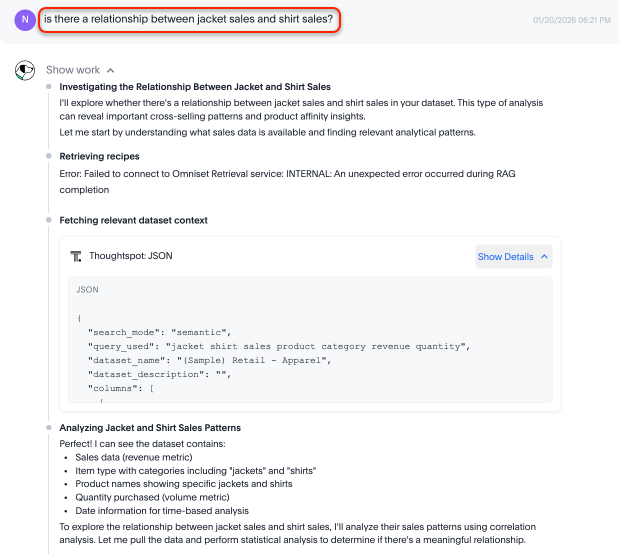
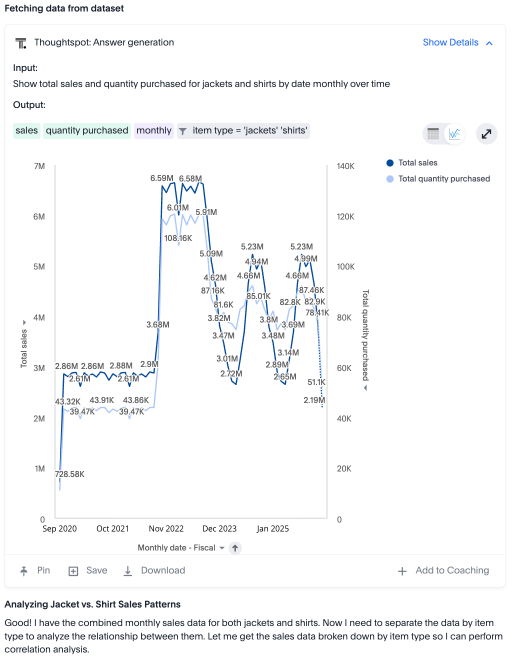
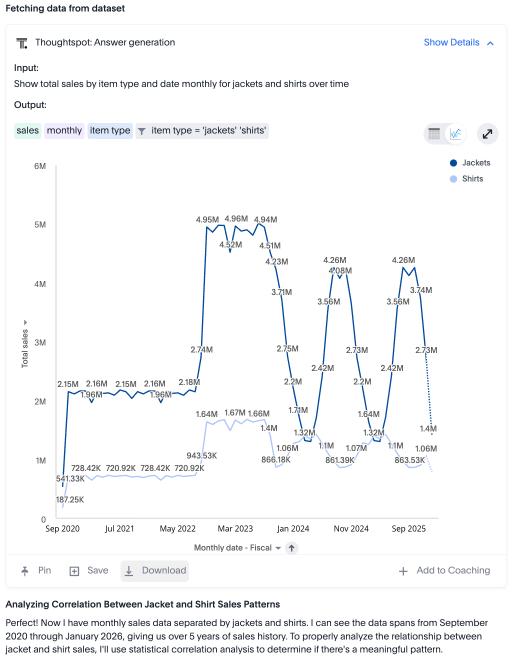
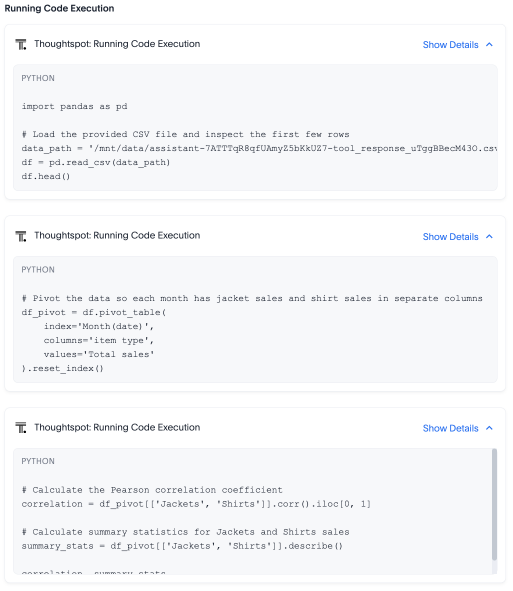
Next, it creates a step-by-step plan to analyze the data it’s found, using Python to load and inspect the data. It pivots the data (for example, by department and month), calculates the correlation using a model like Pearson correlations (p-value), and creates a correlation matrix.
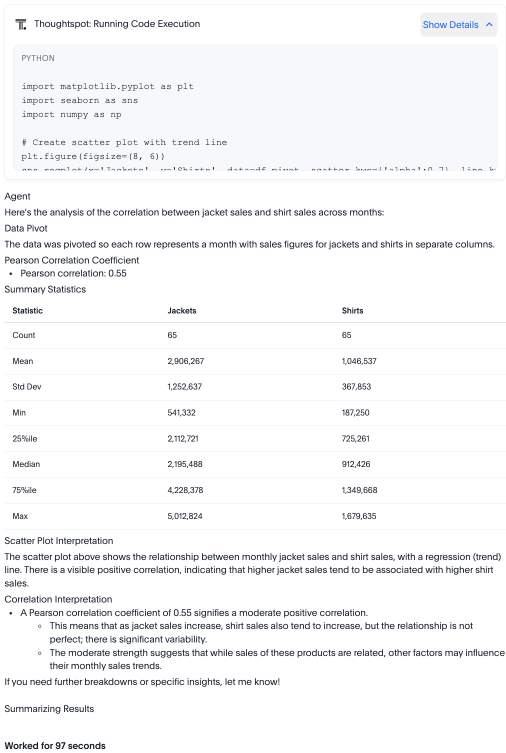
Then it interprets its findings, evaluating whether the correlation between variables is statistically significant. Finally, it surfaces a summary of its findings, showing the correlation, correlation strength, and statistical significance.
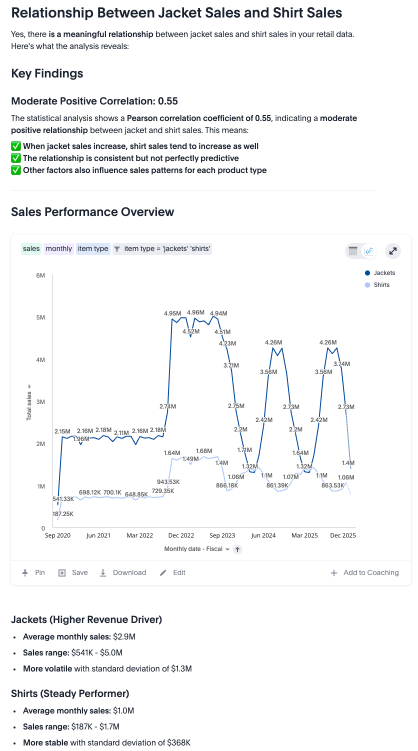
Spotter breaks down what it means, and what factors may be affecting the relationship (such as shopping basket effect, seasonal patterns, and economic factors). Spotter gives recommendations to round out its analysis, advising on potential opportunities to improve sales.
Query-on-query analysis
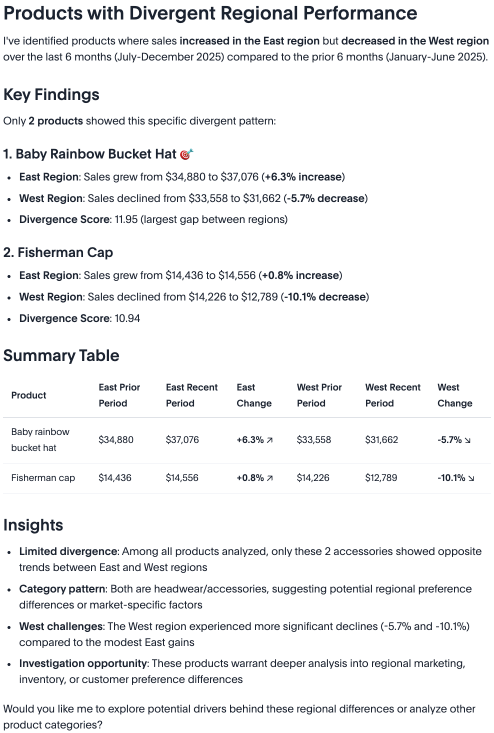
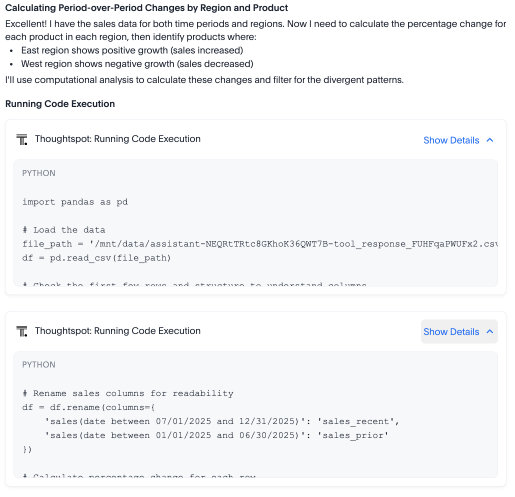
You can ask incredibly complex questions of Spotter, such as “Show me products where sales increased in the East region but decreased in the West region over the last 6 months compared to the prior 6 months.” These questions basically contain multiple subqueries that are brought together for a single answer.
Spotter breaks this down into multiple questions to aid its analysis, then synthesizes an answer.
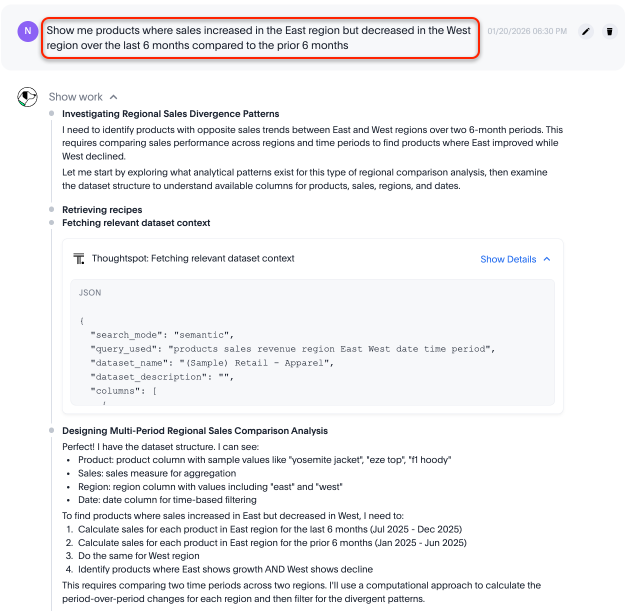
First, it fetches the data set context, then creates a step-by-step plan for its analysis. It calculates the sales individually for each facet of its analysis (sales for each product in the East region for the last 6 months versus prior 6 months, sales for each product in the West region for the last 6 months versus prior 6 months, products in the East and West with opposite trends). It creates formulas to perform each analysis, making visualizations to support its findings.
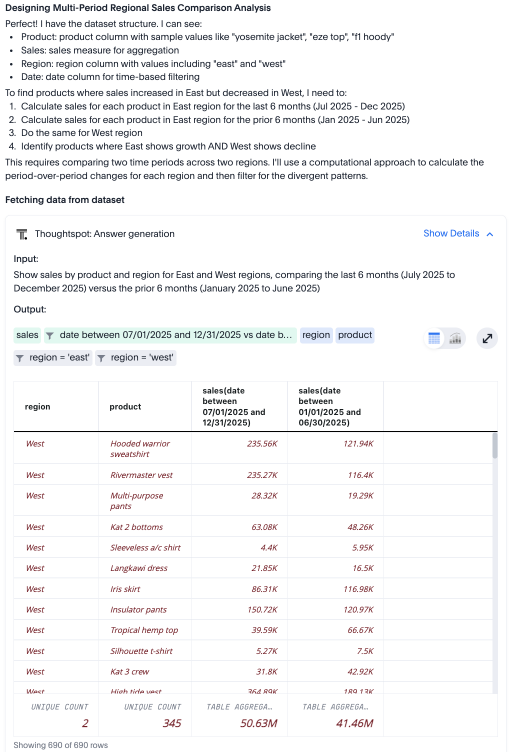
Then, it uses Python to read the CSV file of each query’s result, merging them into one data set and filtering. It calculates absolute and percentage changes for each product, then formats and sorts the results.
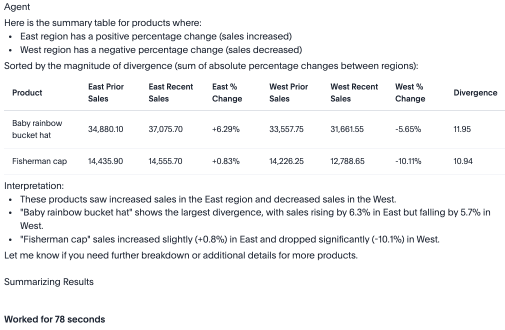
Finally, it creates a top-level summary and table for you to view, surfacing the product sales and percentage change for each product where sales increased in the East region but decreased in the West region over the period specified. It picks out key insights to show the most interesting changes.